A Finite-Element Stress Analysis of A Hypothetical Shaft Coupling
Model Description:
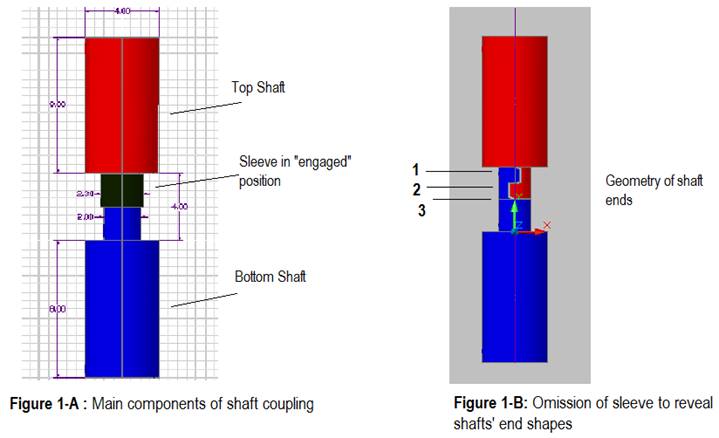
Two shafts with ends of a hook-type design are connected together, and held in place by means of a simple sleeve, as shown in Figures 1-A & B. The sleeve may normally be retained in “engaged” position by the use of a clip, omitted in Figures 1-A & B for clarity. The finite- element model depicts only portions of the shafts near the coupling.
One of the purposes of performing stress analysis on the shaft coupling is to determine location(s) of high stress levels, for failure prediction and design improvement study. Intuitively one may recognize such critical zone(s) directly, by simply identifying the thinnest cross-section(s) of load carrying component(s). In this case study, locations 1, 2 and 3 are possibly weak points in the shaft coupling assembly. FE stress analysis helps elucidating the conjecture in details.
Nominal dimensions of the shaft coupling are given in terms of the radius of shaft end portion. For instance, this radius can be taken as 1 cm. In typical loading conditions, the bottom surface of bottom face can be considered “fixed”, whereas the top face of the top shaft may be subjected to either axial, lateral, or angular displacements, or a combination of these. The simplest loading condition of upward displacement of 0.2 cm is considered in this case.
The components are modeled as isotropic elastic materials with Poisson ratio of 0.3, and elastic modulus of 70,000 Kg/cm/s**2, or 7 MPa (Mega Pascal). Calculated stresses will have units in Kg/cm.s**2. For conversion, 1 Kg/cm.s**2 equals to 0.1 kPa. Elastic modulus of typical aluminum is about 70 GPa. The reason for using scaling factor of 1e-04 in the modulus is to insure accuracy of the results when the calculations are performed on computers with modest resources. The technique avoids very large coefficients in the numerical model’s stiffness matrix. For estimating the stress amounts when the coupling material is actually made of aluminum, the computed stress values should be multiplied by a factor of 1e04. The estimate will be valid provided that the resulting data is less than typical aluminum yield stress.
One of the challenges of the subject numerical model is the treatment of contact interactions, between the two shafts, and between each shaft to the sleeve. In the following calculations, surface-to-surface contact formulation is adopted. For brevity, computed results for the case of axial displacement of 0.2 cm are simply provided below.
Simulation Results:
Figure 2-A: Deformed Coupling Shape.
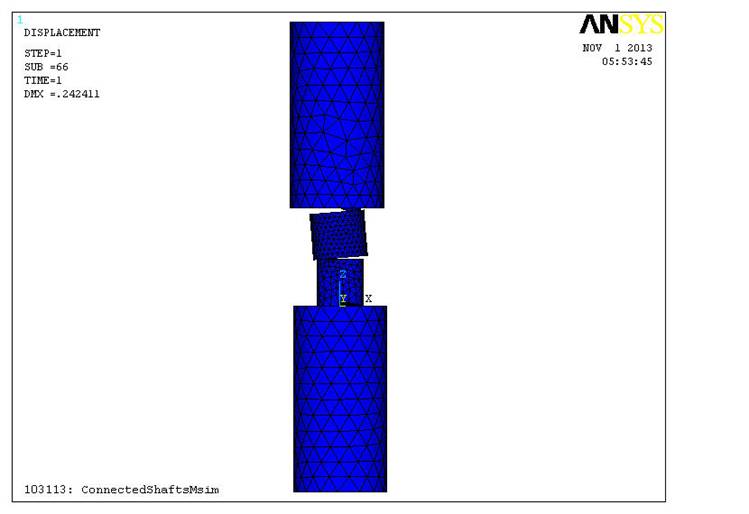
Figure 2-B: Deformed Shafts.
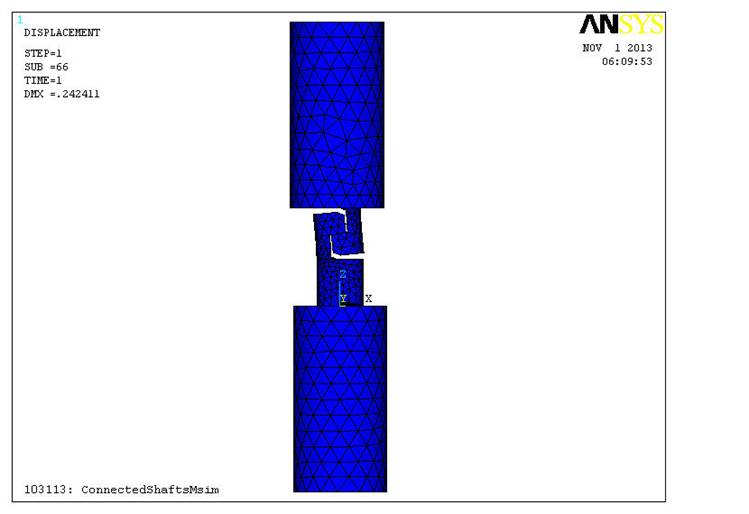
Figure 3-A: A view of Von Mises stress distribution in the coupling.
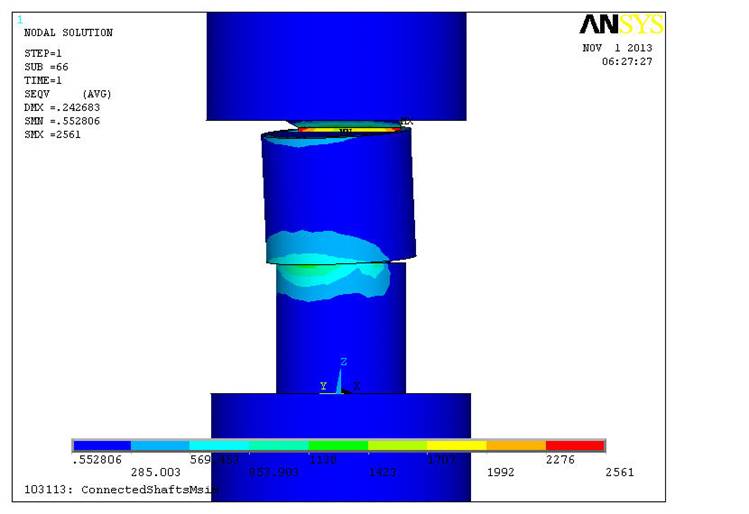
Figure 3-B: A stress distribution view shows high stress level at section 1 of the top shaft.
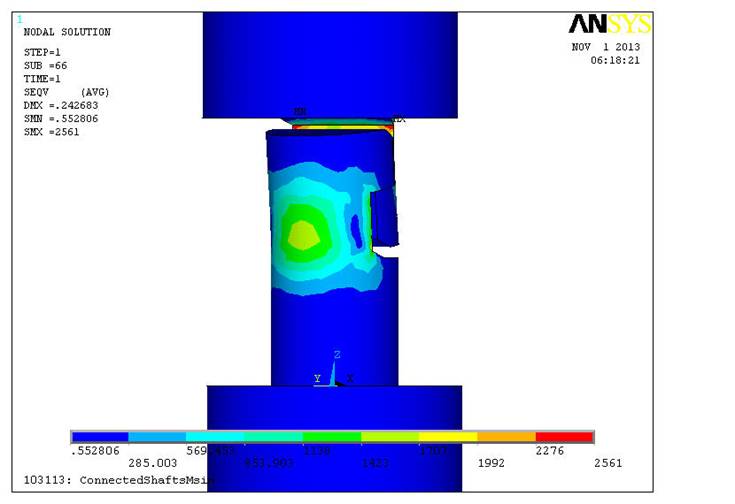
Figure 3-C: High Von Mises stress level is also noticed at section 3 of the bottom shaft
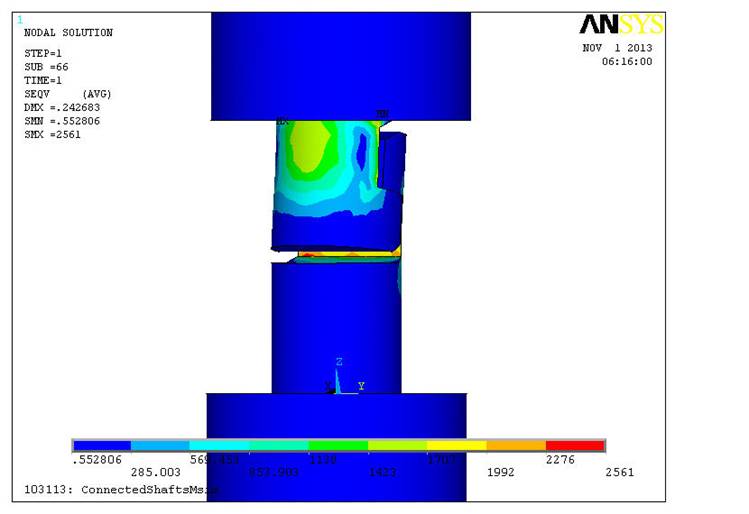
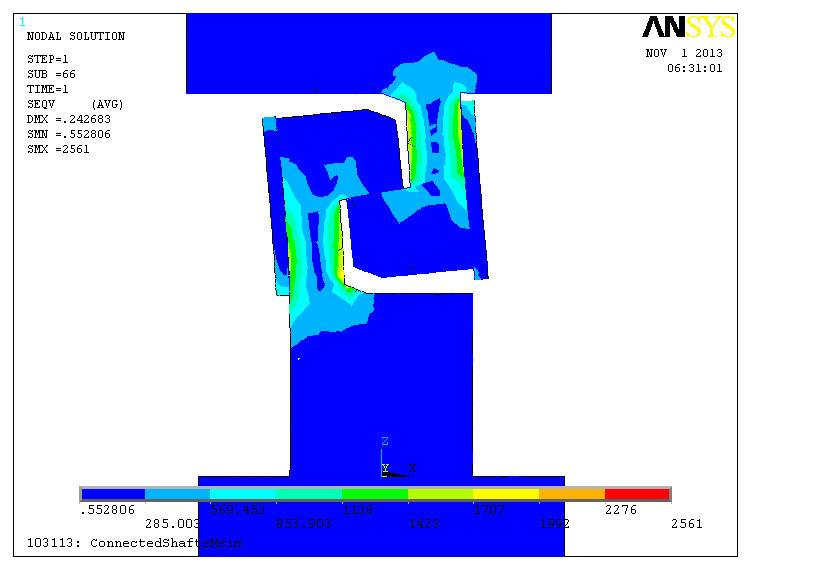
Figure 4: Distribution of Von- Mises stress in a cross-section of the coupling
Animation of Von-Mises stress distribution
Click here to view video (1.4 MB)
The study confirms that the highest stress levels exist at sections 1 and 3 of the top and bottom shafts, respectively, in this axial displacement case. Coupling failures thus likely happen at these locations.
Actual Failure Modes In Similar Coupling Design:
Figure 5: Picture of a shaft pair with hook-type design.
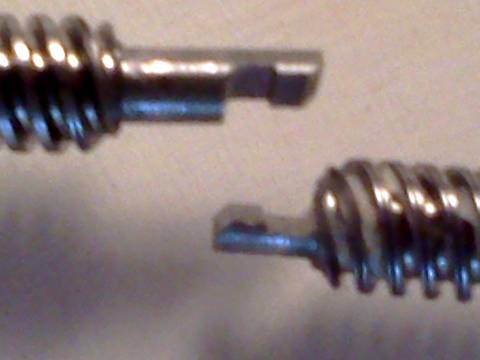
Figure 6: Illustration of failure mode 1, where the top shaft broke off at section 1. The shaft l tail end is visible inside the sleeve.
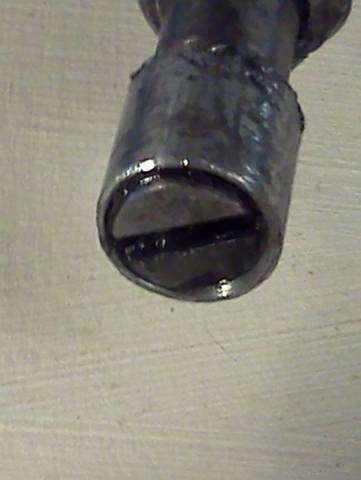
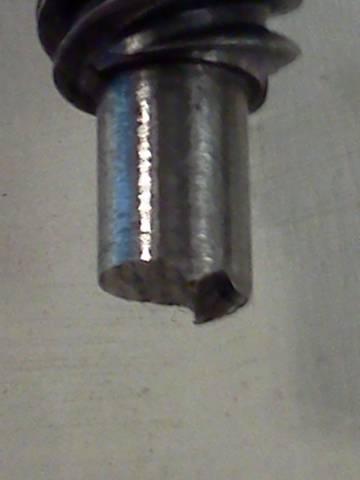
Figure 7: Illustration of failure mode 3, where the bottom shaft broke off at section 3, near the beginning of the sleeve location.
Concluding Remarks:
The numerical simulation verifies that components’ weak-points are at the same failure locations as actually observed in the field. It is worthwhile to consider modifications of the shaft's end shapes for potential durability enhancement.